What Is A Statistical Analysis T-Test And How To Perform One Using Flow Cytometry Data

Designing an antibody panel and running samples on a flow cytometer are not the only steps in a flow cytometry experiment.
After you run your experiment, you have to analyze the data. In particular, you need to perform statistical analyses of the data. This is especially true if you’re hoping to publish your data.
Once all the experiments are concluded and the preliminary analysis of the data performed, you must perform statistical analyses on the data to determine if there is significance in the data.
There are several different statistical tests that can be performed depending on the type of data and the comparisons being made. In the case of either making a comparison against a hypothetical mean, or comparison between two populations, the gold standard test is the Student’s T-Test.
What Is A Statistical T-Test?
The T-Test was developed by chemist William Sealy Gosset, who developed the test while working at the Guinness Brewery as a way to monitor the production of their most famous product.
Since he wasn’t allowed to publish his work directly, the paper was published under a pseudonym in the journal, Biometrika.
Before getting into the details of how the T-Test is performed and how the results are interpreted, there are several factors that need to be kept in mind…
The T-Test makes several assumptions about the data:
- The data is from a Gaussian distribution
- The data is continuous
- The sample is a random sample of the population
- The variance of the populations is equal (If not, there are variations on the theme to address this.)
There are three major variations on the T-Test:
- One-sample T-Test – compares the mean of the experimental sample to a hypothetical mean.
- Unpaired T-Test – compares the mean of the control and experimental samples.
- Paired T-Test – compares the mean of two samples where the observations in one sample can be related to the observation in the second sample. (For example, the effects of treatment on patients where there is a before treatment and after treatment measurement.)
The three pieces of information needed to perform a T-Test:
- The mean of both samples
- The standard deviation of both samples
- The number of observations
The T-Test compares the differences between the means of two populations to determine if the null hypothesis should be rejected. At a minimum, to perform the T-Test, one needs the means and standard deviations of both populations, and the number of measurements.
The researcher also needs to set the threshold value, also termed the α. We will compare this threshold to the P-value. If the P-value is greater than the α, there is no significance in the data. However, if the P-value is less than the α, there is significance in the data.
What Is A Null Hypothesis (HO)?
Simply stated, this is a statement about the relationship of the above two populations. Mathematically, this can be expressed as:
μA = μB
The null hypothesis makes the assumption that our experimental results are from random variation. If, during the statistical analysis, the data is sufficient to show that random variation is not a sufficient explanation for the data, the alternative hypothesis (HA) must be accepted.
A One-Tailed Versus A Two-Tailed T-Test
A T-Test can either be one-tailed or two-tailed. The above example would be an appropriate null hypothesis for a two-tailed T-Test—that is, when the investigators do not know if the treatment will cause an increase or decrease in the measurement. If the investigators expect the treatment will cause an increase OR a decrease, a one-tailed T-Test is more appropriate.
How To Run A T-Test
In the following example, the researchers sought to determine if the percentage of CD4+ T-cells in patients who had Irumodic Syndrome was increased after treatment with Byphodine.
The percentage of CD4+ T-cells was measured on PBMCs before treatment and one week after treatment. Considering this information, this is how you would proceed to run a T-Test…
1. Establish the null hypothesis.
“In patients with Irumodic Syndrome, treatment by Byphodine either decreased or caused no change in the percentage of CD4+ T-cells.”
In this case, since the researchers are not concerned if the treatment causes a decrease in the CD4+ cell, a one-tailed T-test will be performed, and can be written as:
μA ≥ μB
2. Determine the alternate hypothesis.
“In patients with Irumodic Syndrome, treatment by Byphodine increases the percentage of CD4+ T-cells.”
3. Establish the threshold.
By convention, the α is typically set to 0.05. This comes from work by R.A. Fisher who stated in his work Statistical Methods for Research Workers (13th Edition):
The value for which P=0.05, or 1 in 20, is 1.96 or nearly 2; it is convenient to take this point as a limit in judging whether a deviation ought to be considered significant or not. Deviations exceeding twice the standard deviation are thus formally regarded as significant.
There are cases where the threshold can be changed. Increasing the α makes it easier to show significance at the expense of committing a Type I statistical error (false positive). Decreasing the α makes it hard to show significance, and increases the chance of committing a Type II statistical error (false negative). Care must be taken, however, to ensure that the reason for the change is well-documented and spelled out.
For this example, we will set the α to 0.05.
4. Collect the flow cytometry data.
Following all best practices, with a well-controlled instrument, all appropriate gating and reference controls used to generate the data table below.
Table of %CD4+ PBMCs
| Pre-treatment | Post-treatment |
| 18.5 | 26.7 |
| 20.1 | 22.2 |
| 25.2 | 34.5 |
| 16.5 | 23.6 |
| 23.3 | 29.6 |
| 22.6 | 29.1 |
| 18.0 | 40.1 |
| 19.3 | 35.3 |
| 17.4 | 39.5 |
| 19.9 | 31.4 |
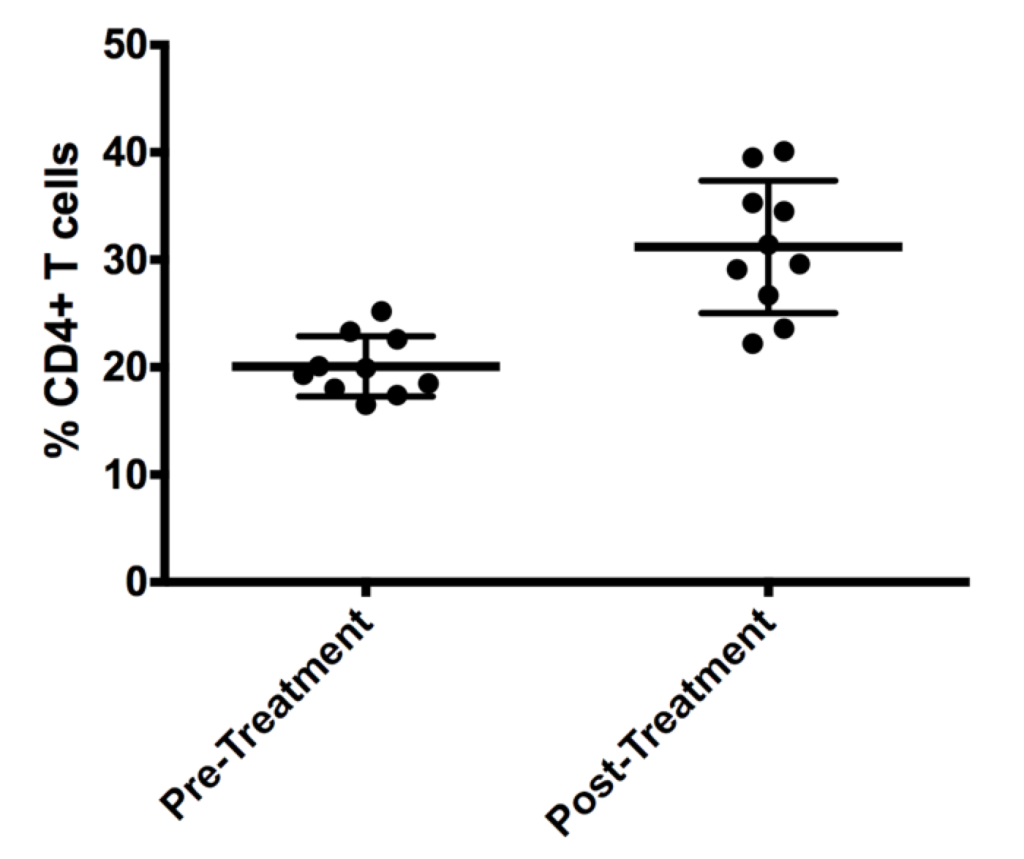
Once this data is entered into our statistical analysis package of choice (we personally use Graphpad Prism), we can generate an appropriate graph:

In the above case, the data is plotted, with the mean and standard deviation plotted.
When the one-way T-Test is calculated, the P-value is 0.0003, which is lower than the threshold. Therefore, the null hypothesis is rejected, and the alternate hypothesis is accepted. As a result, this data supports the conclusion.
The use of the T-Test makes the assumption that the data follows a normal distribution. If this is not the case, there are non-parametric tests that will allow for the statistical analysis similar to the T-Test. These include the Wilcoxon test and the Mann-Whitney test. In non-parametric tests, the data is ranked according to the value (from lowest to highest), regardless of where the data comes from.
Non-parametric tests test the null hypothesis that the data is distributed at random, with the alternate hypothesis being that the data is not randomly distributed, but one population has larger values than the other.
The Student’s T-Test is an essential tool in the researcher’s toolkit to confirm that the data generated in the course of the investigation supports the hypothesis driving the research. Proper application of the T-Test (and related non-parametric tests) to determine statistical significance in the data will improve confidence in the conclusions of any published work. Following the steps outlined above will allow the researcher to correctly apply the proper statistical tool for their data.
To learn more about getting your flow cytometry data published and to get access to all of our advanced materials including 20 training videos, presentations, workbooks, and private group membership, get on the Flow Cytometry Mastery Class wait list.

ABOUT TIM BUSHNELL, PHD
Tim Bushnell holds a PhD in Biology from the Rensselaer Polytechnic Institute. He is a co-founder of—and didactic mind behind—ExCyte, the world’s leading flow cytometry training company, which organization boasts a veritable library of in-the-lab resources on sequencing, microscopy, and related topics in the life sciences.
More Written by Tim Bushnell, PhD


