5 Steps To Improve Your Flow Cytometry Data Analysis

With the continued emphasis on improving the reproducibility of scientific data, it is critical to remember that there is no single step that will solve this problem. Instead, it is a mindset that needs to be adopted. From adding in additional descriptors in the data to ensuring the proper information is extracted these steps, especially when communicated, can improve the robustness of your data. Further, as more and more automated analytical tools are being developed, using
Improving the quality of your data starts with how you approach your data analysis process, your experimental design and what happens when you sit down at the instrument.
1. Add keywords at the beginning of your experimental setup.
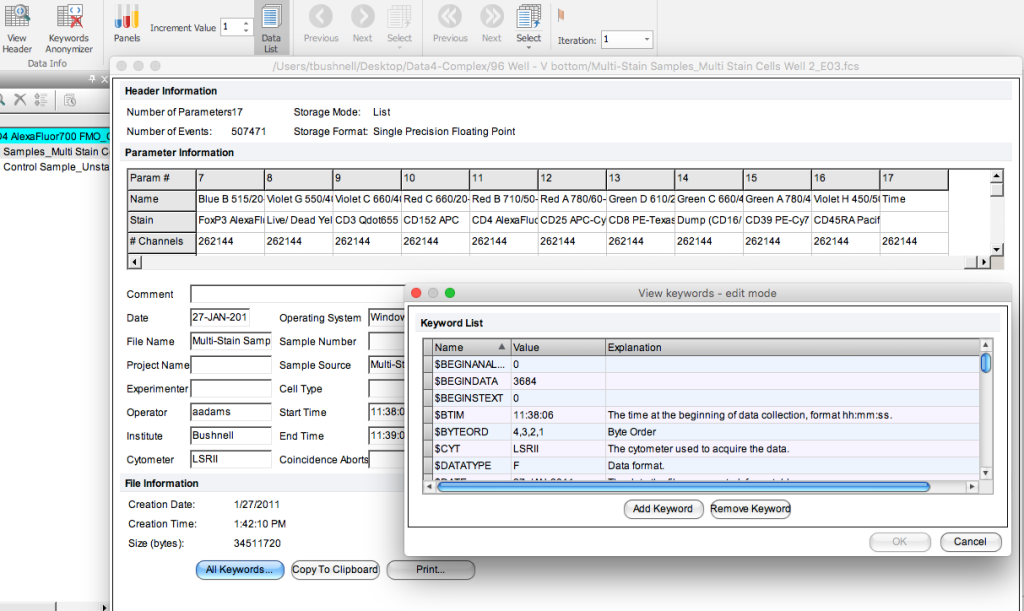
The flow cytometry standard file (FCS) is composed of two pieces – the listmode data, a spreadsheet of the values for each cell and a header filer – which is where the keywords are stored. These keywords are defined by the FCS standard and are automatically added by the instrument to the file. When troubleshooting an experiment, this is a good place to look at how the system was set up for the acquisition.
In addition to these defined terms, you are able to add keywords to your flow cytometry data when setting up your experiment. By doing this, it is possible to add information about the sample, the stains, the treatment conditions, etc. that ultimately makes it easier to search and organize your files during analysis.
It is important when adding keywords, especially when performing a longitudinal study, that the terms are consistently entered. Depending on the downstream applications and how you might parse the keywords – CD3 is different from Cd3 and T0 is not the same as T=0. So make sure you are consistent in this process.
If you are using FCS Express, you can access this under the Data Tab. This brings up a window that also allows you to select all keywords. Additionally, you can add keywords here if needed. Another nice feature is that if you have information stored in the header file that needs to be removed for privacy reasons, there is an option to anonymize the header information. A great way to protect files with PHI or other sensitive information.

Figure 1: FCS Header as displayed in FCS Express 6.
Developing your naming convention during the experimental design phase is a good practice. This way it becomes ingrained into the workflow and template design.
2. Develop a quality control program.
Quality control is the name of the game to help improve the quality and consistency of any data generated. Instrument quality control is typically performed using some OEM recommendation that is implemented by those in charge of the instruments. It’s a good idea to ask them about this QC and if you can review it from time to time. The last thing that you want to have happen is that your big find turns out to be an instrument issue rather than biological. QC helps prevent this by ensuring the instrument is running the same way on a daily/weekly/monthly basis.
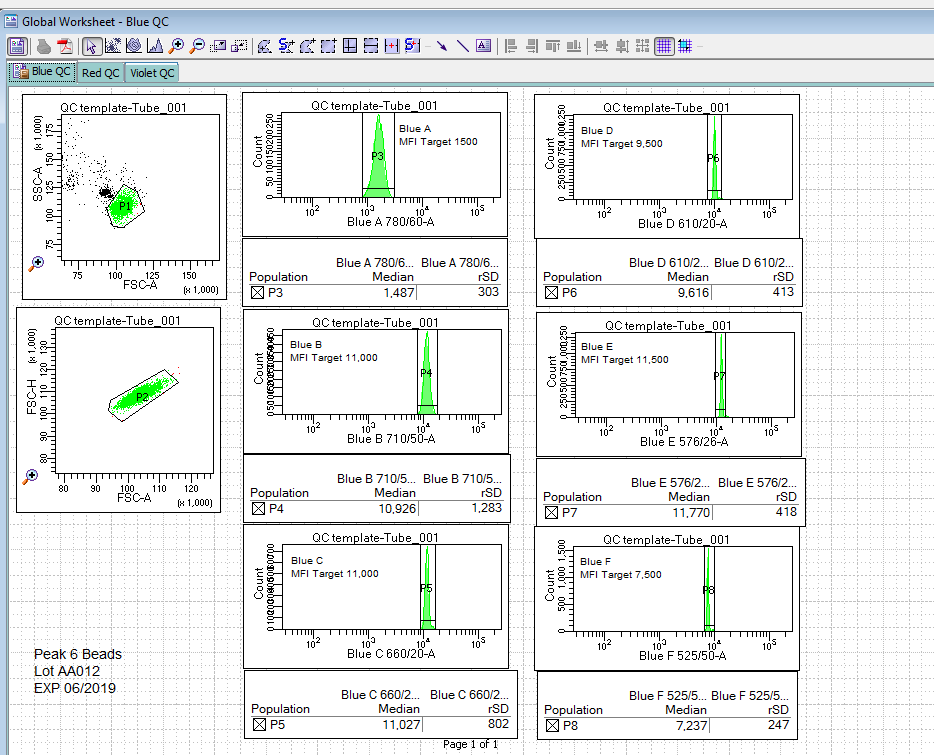
However, that is not where it should end. Each researcher should invest a bit of time to add experimental quality control to their experiments. This QC helps ensure that when you go to sit down to the machine at 20:00, after a long day of preparing your sample, that everything is still working. This can easily be achieved by using a bead and establishing target values for this bead based on the experiment. These values would be determined during the optimization phase of experimental development. Figure 2 shows what such a template might look like.

Figure 2: Experimental QC template.
This template indicates the name, lot and expiration date for the QC beads. On each of the plots is a target value to reach when setting up the experiment.
Advantages of this method are that it provides the researcher with a separate QC that can be tracked and used to show consistency in their data acquisition process. It will also reveal if there are issues with the instrument before the actual samples are put on the system.
A second recommendation for a QC program is to introduce a reference control into the experimental workflow. This is a sample that you know how it should behave when stained, and helps to ensure that the staining process worked. An added advantage of the reference control is that it is an ideal sample to train others on the protocol. If they can’t get the expected results, then back to pipet school for them!
3. Доверяй, но проверяй.
As the Russian proverb tells us, Доверяй, но проверяй, (trust, but verify). Many software packages have automatic settings for compensation. These settings and the impact that they have on compensation should not be used without verification. There are three that are particularly important to check.
- The number of events to collect – Compensation is based on a statistical measure of the central tendency of the negative and positive populations. The better this measure, the better the determination of compensation. This begs the question of how many events are enough? As was discussed in a previous post on this site, when using a bead-based carrier, make sure to collect at least 10,000 events. For cells as a carrier, at least 30,000. If you are using cells and the target is a rarer event, collecting more events is necessary. This is one reason that beads are a useful control.
- Avoid the universal negative – Many software packages drive the compensation analysis down a path where a single tube is used to set the negative populations for compensation. This is ultimately a violation of the second rule of compensation, which requires the positive and negative carrier to have the same autofluorescence. The best practice is to have both a negative and positive control in each compensation tube so that when compensating, there is no ambiguity or concerns over was the second rule violated.
 Figure 3: Issues with using a ‘Universal’ negative in compensation.
 - Check the automatic gating – In some software, compensation is automated to identifies the target particles and gates the positive and negative sample. This can work very well if the samples are clean and well separated. However, in the case of using cells, or with samples with debris, this gating can fail. An example of this is shown below in.
 Figure 4: When automatic compensation goes wrong The debris in the compensation control tube seems to cause the algorithm some confusion, (right), and the software generates an oddly shaped gate that includes this debris and only part of the correct sample. Contrast that to the sample on the right, which has a similar pattern, but the software clearly captures the correct population.
While using automatic compensation is the correct way to compensate the experiment, make sure that these glitches are corrected before compensation is calculated.
4. Use all the proper controls.
One of the most important factors in improving reproducibility is to use the correct controls in the experiment. These samples change one thing compared to the experimental sample so that it is possible to assess changes that are due to the experimental parameters and not the data acquisition process.
A lot has been written on proper controls for a flow cytometry experiment such as this article. In addition to quality control, as discussed above, proper experimental controls include compensation controls, FMO controls, unstained (autofluorescence) controls, un-stimulated controls, and positive controls.
It goes without saying that each control should be used for what it is designed to control for and not overinterpreted and that these controls work in concert to set the correct gates to identify the populations of interest.

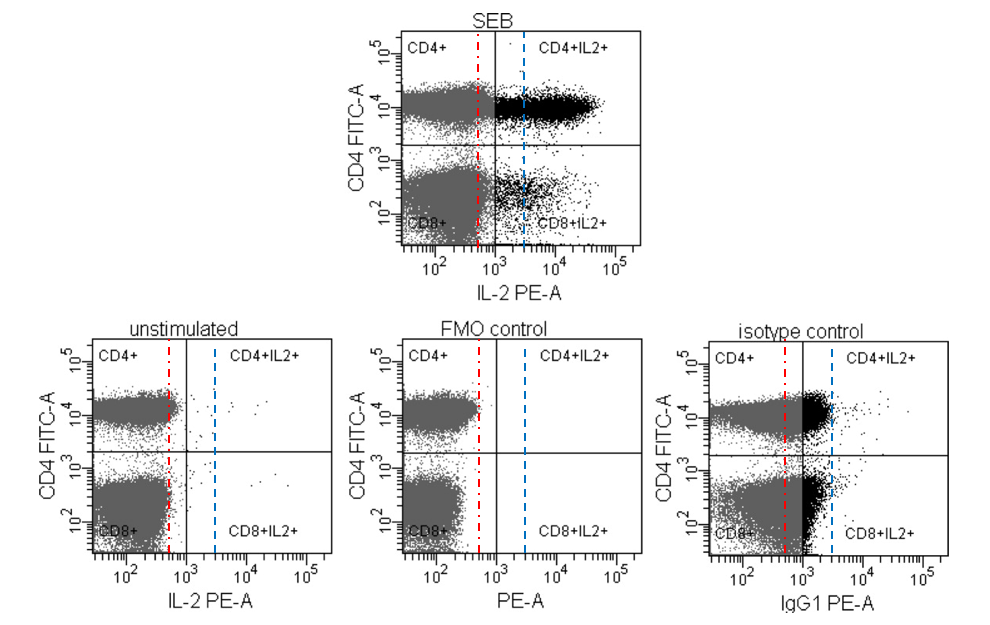
Figure 5: Using FMO and Unstimulated controls in concert to properly set gates. Data from Maecker and Trotter (2006). Dashed lines are added for illustration purposes.
In figure 5, the authors show three different controls that could be used to set gates on the stimulate sample at the top. The Isotype control, a historical control that has marginal value, has been discussed in detail in this article. The blue line represents this control, and as is shown on the plot on the top, would significantly reduce the number of positive cells.
The FMO control (red line) is used to address issues of spectral spillover into the channel of interest. Looking at the lower left plot, there appear to be some background binding of the target antibody on the unstimulated cells, so the final gate needs to take this into account.
When developing a panel, during the optimization phase, put all the controls you can think of to test. The goal is to identify which controls are critical for identifying the populations of interest, and those that do not help in that process can be excluded.
5. Extract the correct data.
In hypothesis-driven science, the goal is to extract the correct information from a set of experiments and use that in an appropriate statistical test to confirm or refute the hypothesis. Even before performing experiments, this information needs to be considered and determined so that an analysis plan can be established. Doing this before performing experiments will prevent HARKing – hypothesizing after results are known, and p Hacking – where multiple statistical tests are performed to identify one that demonstrates significance in the data.
Performing the correct statistical test is essential to reproducible data, as was discussed here. Make sure that you’re taking the time at the start of the experiment to develop this plan. Knowing what the critical data are to extract from the experiments will help guide the experimental design, as well as helping to identify the critical controls to be run. Thus, it’s critical to ensure that this plan is developed well in advance of putting cells on the cytometer.
To get the best flow cytometry data you need to be thinking about all the steps in your experiment to ensure that you have high-quality data to analyze. To improve the quality of your analysis and to properly track your experiments, make sure you’re adding keywords at the beginning of your experimental setup. Don’t rely on just the daily QC that is performed on the instrument – develop a quality control program that is appropriate for your experiments to add confidence in your results. When using automated compensation programs leave the wizards to fantasy and verify that the algorithms have performed correctly. Identify and don’t misuse or overinterpret the controls when analyzing the data. Finally, know what the end goal of the experiments is and make sure to extract the appropriate data.
These steps will ultimately help improve the reproducibility of your experiments and confidence in the conclusions.
To learn more about the 5 Steps To Improve Your Flow Cytometry Data Analysis, and to get access to all of our advanced materials including 20 training videos, presentations, workbooks, and private group membership, get on the Flow Cytometry Mastery Class wait list.

ABOUT TIM BUSHNELL, PHD
Tim Bushnell holds a PhD in Biology from the Rensselaer Polytechnic Institute. He is a co-founder of—and didactic mind behind—ExCyte, the world’s leading flow cytometry training company, which organization boasts a veritable library of in-the-lab resources on sequencing, microscopy, and related topics in the life sciences.
More Written by Tim Bushnell, PhD


