How To Perform A T-Test

With the ability to capture expression data at the single cell level through many thousands of cells in a short time, flow cytometry data is very numbers rich. The importance of those numbers and how to use them in hypothesis testing is critical to ensure the robustness of the analysis.
After establishing the null hypothesis for the experiment, the type of statistical test, and the numbers necessary will become obvious. For example, if the null hypothesis states that the ‘treatment of B cells with thiotimoline does not change the expression of CD221B in normal patients.’
Based on this null hypothesis:
1. Assuming a gaussian distribution, a T-test will be performed.
2. The median and robust Standard Deviation will need to be known for the untreated and treated samples.
3. Additionally, the threshold needs to be establish. In this experiment the threshold is set to 0.01.
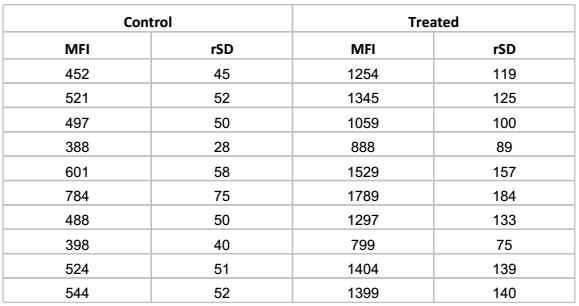
Here is the data:

Using a statistical tool, such as Graphpad Prism, the T-Test can be performed. Based on that result, the P value is less than 0.0001, which is below our threshold. Therefore the data is significant.
There are some limitations with directly comparing the median fluorescent intensities, especially in the case of a multi-center study with different instrumentation and such. In that case, the conversion of the data to a resolution metric, such as the RD is recommended. In this case, a one-sample T-Test can be performed on the data.
The RD is defined as follows:
RD = (MedianA-MedianB)/(rSDA+rSDB)
If the above data were to be converted, A would be defined as the treated sample and B as the control sample. That would result in the following data:
A one-sample T-test allows the comparison of a single sample to be compared to a known population mean. In this case, the mean would be 0. This is because the assumption is that the treatment causes no effect, so MedianA-MedianB would be 0.
Running the T-test, the results show, as expected, that this data is statistically significant.
The advantage of the RD is that issues with the experimental system (labeling, cell number etc), and the instrument can be smoothed out – making comparisons easier to interpret and understand.
This is a simple case of the power of statistics in flow cytometry. Please join me for an upcoming lecture where this and other topics such as statistical errors (and how to avoid them), ANOVA and linear regression will be discussed.

ABOUT TIM BUSHNELL, PHD
Tim Bushnell holds a PhD in Biology from the Rensselaer Polytechnic Institute. He is a co-founder of—and didactic mind behind—ExCyte, the world’s leading flow cytometry training company, which organization boasts a veritable library of in-the-lab resources on sequencing, microscopy, and related topics in the life sciences.
More Written by Tim Bushnell, PhD


