Why Understanding Fluorochromes Is Important In Flow Cytometry

At the most basic level, a flow cytometer is photon counting device. It captures the emitted photons from fluorochromes present on targets — be they cells, beads, or other particles.
These fluorochromes can be attached to antibodies or proteins (like Annexin), free molecules that become fluorescent when bound to a target (DNA dyes), or have different fluorescent characteristics under different biological conditions (Indo-1, JC-1).
Fluorescent molecules are the tools of the trade in flow cytometry and, with continued advances in chemistries, it is helpful to step back and review their essential properties.
Why Understanding The Jablonski Diagram Is Important
When a molecule absorbs a photon of light, an electron is promoted to a higher energy state. This excited state is not stable, and the molecule releases this energy in several different ways.
When the release of energy is an emission of light, it is termed fluorescence.
This process can be visualized by the Jablonski diagram, which is a useful way to model the electronic states of a compound. Such a diagram is shown below (see Figure 1 for a generalized Jablonski diagram of fluorescence).
The emitted photon is of a higher wavelength (and therefore lower energy) than the exciting photon.
This process can be visualized using one of several spectral viewers available from various vendors.
Spectral viewers allow the researcher to understand the emission and excitation properties of a given fluorochrome and help them determine the best excitation line and emission filter set to use for that fluorochrome.

Figure 1. A generalized Jablonski diagram of fluorescence
What Are The 5 Classes Of Fluorochromes?
In general, fluorochromes can be divided into 5 broad categories, which are discussed below.
1. Fluorescent Proteins.
Fluorescent proteins can be categorized into two groups.
The first group is made of natural proteins that encode their fluorescence in the protein structure. These fluorescent proteins include green fluorescent protein (GFP), YFP, RFP, and various derivatives that have been mutated and validated.
Many fluorescent proteins are commercially available in expression vectors to allow researchers to clone them into a vector expressing their favorite targets and follow the expression of the target by using the fluorescent surrogate.
A second class of fluorescent proteins are those derived from the phycobiliproteins found in algae and plants. These proteins use phycobilin cofactors to harvest light and include phycoerythrin (PE), allophycocyanin (APC), and peridinin chlorophyll (PerCP).
Phycobiliproteins, especially PE, are among the brightest fluorescent molecules currently available to researchers (see Figure 2 for the structure of phycoerythrin and its cofactor).
It should be noted that, while very good for flow cytometry, these molecules are not well-suited for fluorescence microscopy because they rapidly photobleach.
Figure 2: (A) the chromophore in phycoerythrin. (B) the structure of phycoerythrin.

2. Synthetic Small Molecules.
Synthetic molecules are a broad class of relatively small fluorescent compounds that have a long history in flow cytometry.
These molecules all contain at least one conjugated double bond system — in rings, chains, or a combination of both —- that is perturbed upon excitation (see Figure 3 for example structures of FITC and Cy5).
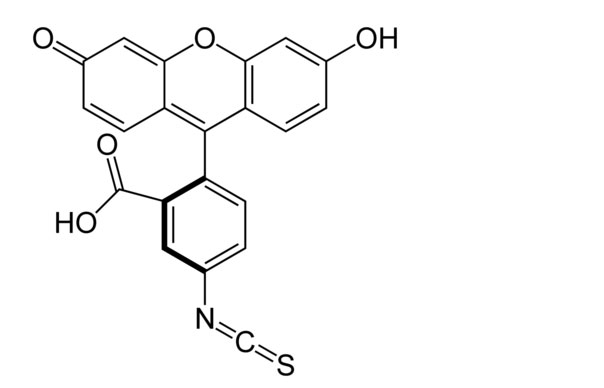

Figure 3: The structure of fluorescein isothiocyanate (FITC), from the wiki entry and the structure of Cy5 from the Heterocyclist.
Synthetic dyes are available across the spectrum and come in a variety of configurations that influence solubility and cell permeability.
They are also amenable to chemical modifications for fine-tune targeting through conjugation to lipids, antibodies, and other biomolecules or ligands.
3. Quantum Dots.
In the late 2000s, the use of quantum dots (QDots) became popular.
The QDot is a semiconductor that can be tuned to different emission wavelengths based on the size of the particle (see Figure 4 for an illustration of QDot fluorescence).
These QDots have excellent quantum yields and are very photostable.
The major challenges have been achieving aqueous solubility and creating a surface amenable to conjugation chemistries.
In flow cytometry, QDots are typically excited by the violet laser, although they can be excited by any light below the emission maximum, and so need careful planning when used in panels.

Figure 4. Quantum dye fluorescence is related to particle size. Image from Printed Electronics Now
4. Polymer Dyes.
More recently, polymer dyes have become popular.
Developed by Sirigen and first introduced to flow cytometry by BioLegend, these compounds are extremely bright (BV421 is at least twice as bright as PE) and take advantage of the violet laser, like the QDots.
Since the introduction of Brilliant Violet, additional polymers for UV excitation (Brilliant UV) and blue excitation (Brilliant Blue) have been developed.
The brilliant series of dyes — based on Nobel Prize winning chemistry — work by having multiple segments that absorb light, and when that happens, electrons migrate along the chain.
The polymer backbone itself is fluorescent (such as BV241), or can be coupled to an acceptor fluorochrome, forming a tandem dye (see Figure 5 for an illustration of polymer dye structure).
One upside of these dyes is as appropriate polymers are developed, additional spectral space will become open. In addition to the Brilliant Violet dyes, there are already Brilliant UV (6 dyes) and Brilliant Blue (2 dyes) on the market.

Figure 5: Brilliant Violet dyes. (A) Principles of how the Brilliant Violet dyes work . (B) some of the BV dyes available for flow cytometry. Figures from Sirigen website.
5. Tandem Dyes.
Finally, there are the tandem dyes.
Tandem dyes are a special class of fluorescent molecule that take advantage of Förster resonance energy transfer (termed FRET, or fluorescence resonance energy transfer).
In this process, two fluorochromes are placed in close proximity. The emission of the donor molecule must overlap with the excitation of the acceptor molecule.
When the donor molecule is excited, an electron is promoted to a higher energy state and transfers the energy to the acceptor molecule, which returns to ground state, giving off a photon of light (see Figure 6 for a Jablonski diagram of tandem dye fluorescence).
Tandem dyes are very useful as they can extend the usable spectrum for a given excitation laser.

Figure 6: Jablonski diagram of FRET. By Alex M Mooney – Own work, CC BY-SA 3.0, https://commons.wikimedia.org/w/index.php?curid=23197114
FRET efficiency falls off at the 6th power of the distance, so these manufactured dyes must be protected from conditions that create free radicals, lest the tandem dye can decouple and fall apart. Some of these conditions include light, changes in temperate, age, and fixatives.
Historically, tandem dyes were named as the donor acceptor combination, so researchers are familiar with dyes like PE-Cy5 and APC-Cy7. With the advent of the brilliant violet dye series, this naming convention was discarded. Some dyes, including BV570, BV605, BV650, BV711, and BV786, are tandem dyes, even though there is no indication of this status in their name.
How To Understand Brightness In Flow Cytometry
Ranking these fluorochromes is essential for the researcher, as brightness plays a critical role in panel design.
Brighter fluorochromes should be reserved for critical markers — be they of low or unknown expression, or on rare events.
While it is possible to describe brightness in terms of quantum yield and efficiency, these values are not easy to relate to in a practical sense. Thus, flow cytometrists often discuss brightness in terms of the ‘staining index’, which was described in a paper by Maecker and co-workers (see Figure 7 for an illustration of staining index).

Figure 7: Measuring SI based on Maecker et al. (2004) Cytometry A 62:169
There are several charts online, with varying selections of fluorochromes. The one below from BioLegend has many of the newer dyes.

Figure 8: Fluorochrome brightness chart. The full chart can be found here.
This data is also integrated into the panel design program from Fluorofinder, which assists in the panel design process, meaning you don’t have to flip back and forth between several screens to determine the relative brightness when designing your polychromatic panel.
With the continued development of new fluorochromes, it is critical to stay up on the trends.
While early adoption of new fluorochromes is exciting, there are times that problems lurk that we do not discover till many years later.
Many researchers using Quantum Dots were surprised when Zarkowsky and co-workers published their paper that detailed how copper ions, at nanomolar levels in some commercial fixatives, quenched QDot fluorescence. How many experiments had to be redone because of this finding?
The polymer dyes are reported to aggregate when more than one is used in staining, so the use of the recommended staining buffer is an important consideration when using them in your panels.
Considerations that must be made when choosing fluorochromes include the brightness of the dyes in question, the instrument configuration, and the staining protocol. Each of these factors will impact the quality of the data because of issues related to spectral spillover, staining, loss of signal because of tandem dye degradation, the ability to get an antibody/fluorochrome into a cell, and more. It takes time and effort to develop and optimize a panel. If one fluorochrome doesn’t work, consider why it may have failed and look for alternatives.
To learn more about Why Understanding Fluorochromes Is Important In Flow Cytometry, and to get access to all of our advanced materials including 20 training videos, presentations, workbooks, and private group membership, get on the Flow Cytometry Mastery Class wait list.

ABOUT TIM BUSHNELL, PHD
Tim Bushnell holds a PhD in Biology from the Rensselaer Polytechnic Institute. He is a co-founder of—and didactic mind behind—ExCyte, the world’s leading flow cytometry training company, which organization boasts a veritable library of in-the-lab resources on sequencing, microscopy, and related topics in the life sciences.
More Written by Tim Bushnell, PhD


