3 Ways To Measure Cell Death With Flow Cytometry

Cell death is a natural part of the lifecycle of a cell. In cases of development, it is critical for the shaping of fingers during human development. The processes of ordered cell death, or Apoptosis, are so important that in 2002, Sidney Brenner, Robert Horvitz, and John Sulston received the Nobel Prize in Medicine for their work on understanding this process. There are many different ways to measure cell death and flow cytometry is an ideal tool for this technique. Whether you are just assessing the viability of your cells or you are interested in the exact stage of cell death your sample is in, there are a variety of ways that you can measure cell death.
The most basic reason to measure the end result of cell death is to ensure the quality of your cell sorting experiment. Sorting dead cells for downstream analysis is a waste of time and money. This will also yield spurious results.
Researchers developing new drugs that can kill cancer cells can use this technique to determine appropriate concentrations of drug to use, what combinations of drugs might be more effective and so on.
Whether you are just assessing the viability of your cells or you are interested in the exact stage of cell death your sample is in, there are a variety of ways that you can measure cell death.
Learn how can you use flow cytometry to measure cell death and get better results in your flow experiments…
1. Viability dyes.
When a cell dies, the cell membrane loses its integrity, allowing anything to enter into the cell. Flow cytometrists can take advantage of this by using cell impermeant dyes to identify the dead cells. However, these will not work if the researcher is staining for an intracellular target. In this case, the use of amine-reactive dyes is called for.
This figure, which can be found on the BioLegend website, shows the difference between the amine reactive dyes (on the left) and the cell impermeant dyes (on the right).
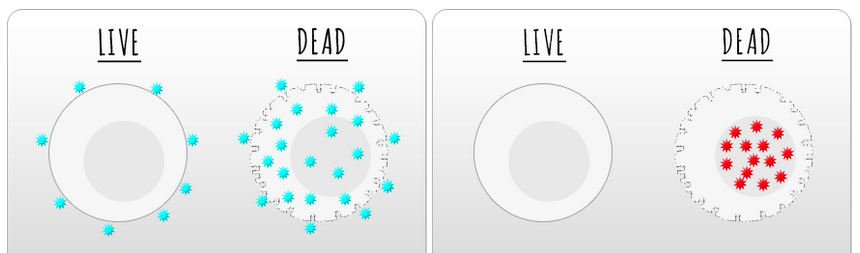
Figure 1: Staining for dead cells using Amine-reactive dyes (left) or cell impermeant dyes (right).
Cell impermeant dyes are typically DNA binding dyes, and can only enter the cell if the membrane is compromised. There are a wide variety of these dyes, and some of the most common are shown in the table below.
Table 1: Common DNA viability dyes
| Dye | Excitation max (nm) | Emission max (nm) | Laser(s) (nm) |
| Propidium Iodide (PI) | 535 | 617 | 488, 532 |
| 7AAD | 546 | 647 | 488, 532 |
| DAPI | 355 | 460 | 355, 408 |
| Draq-7 | 600 | 677 | 633 |
Invitrogen has a large number of other dyes in their SYTOX line, which span multiple excitation lines.
To use these viability dyes, the researcher should add the dye before analysis or sorting. Now some researchers are concerned about adding these dyes to a sample in case they will impact downstream analysis, especially in Genomics. This is not the case for two reasons. First, the amount of dye used for this purpose is much lower (10-100X) than used for cell cycle analysis. Second is the dilution factor. If you sort a cell with an 85-micron nozzle, the droplet size has a volume measured in nanoliters and the core stream is only a fraction of that volume, so the amount of the dye that will be remaining after sorting is negligible.

Figure 2: Cells stained with either DAPI (A) or 7-AAD (B). Data from the Blizard Institute’s website.
Since these dyes require an intact membrane to exclude the dye. This doesn’t work when performing an intracellular staining assay or having to fix the cells before analysis. There have been various techniques used in the past, to varying degrees of success. With the introduction of the amine reactive dyes, the ability to identify dead cells became that much easier. These dyes work by binding to the amine groups on proteins. As shown in Figure 1 above, these dyes will bind to the surface of a cell, making live cells slightly positive. Dead cells, with compromised membranes, allow for the dye to enter the cell, where there are a lot more proteins for the dyes to bind to. These dyes have fanciful names such as Zombie and Ghost as well as the more generic ‘Amine Reactive Dyes.’

Figure 3: Identification of dead cells using the amine reactive dyes (left). The figure on the right is from the Thermo Fisher website showing the staining of live and dead cells.
It’s really important when you’re staining with the amine reactive dyes to stain them in the absence of protein so that the free protein does not suck up the amine-reactive dye.
2. Apoptosis assays.
Programmed cell death, or apoptosis, is the body’s way to eliminate cells in a systematic way. This can be a damaged cell, or it can be part of the normal biological process of development. For example, in utero the fingers are webbed and it is through ordered apoptosis that this webbing gets removed.
In Apoptosis, one of the earliest signals is the flipping of the phosphatidylserines, which face the cytosolic side when a cell is living, but by the action of flippase, face the extracellular milieu when a cell is undergoing Apoptosis. Annexin V is a calcium-dependent phosphatidylserine preferentially-binding protein. When coupled with a cell impermeant dye, it is possible to dissect the stages of apoptosis, as shown in the figure below.

Figure 4: Annexin V staining of cells undergoing drug treatment. Cells in the lower right quadrant bind Annexin and are at the early stages of cell death.
The Annexin V assay lends itself to high content screening assays, which makes it ideal for monitoring cell death in drug screening assays.
Another assay that can be run to look for the earliest stages of apoptosis uses two different dyes. In the case shown below, the DNA binding dye, Yo-Pro-1 will enter the cell before PI can. Using these two dyes, it is possible to identify the apoptotic cells from necrotic cells. Necrosis is disordered cell death, usually due to traumatic cell damage and the release of proteins from the lysosomes (a process called autolysis). The example data, courtesy of Derek Davies, shows an example of how these two dyes work.

Figure 5: Measuring apoptosis and necrosis by flow cytometry. Data courtesy of Derek Davies.
3. Mitochondria dyes.
Another hallmark of apoptosis is the depolarization of the mitochondria and the release of cytochrome C.
Cytochrome C can be measured by intracellular staining using an anti-Cytochrome C antibody. As Cytochrome C is released, the amount of staining will go down. Example data from King et al. (2007) is shown below. In this assay, cells were treated with staurosporine to induce cell death.

Figure 6: Cytochrome C release as measured by intracellular staining.
The process of Cytochrome C release requires the depolarization of the mitochondria. There are a variety of dyes that can measure mitochondrial membrane depolarization including JC 1 or CMX Ross. In this example, cells were stained with CMXRos and counterstained with To-Pro-3, a DNA binding dye. On the left are the untreated cells, while on the right are the treated cells. The depolarisation shows a decrease in the signal of the CMXRos.

Figure 7: Measuring membrane depolarization using CMXRos. Data from Derek Davies.
Cell death is a normal biological process that is amenable to measurement by flow cytometry. Cell impermeant dyes are an absolute requirement for cell sorting experiments, or for live cell analysis. Since dead cells can mimic the target cell, these must be eliminated. For intracellular staining, the amine reactive dyes are an excellent choice.
Annexin V assay is a good assay to measure cell death and is a great tool for looking at cell death in a high-throughput assay. Additionally, there are several DNA dyes that can be used in this process as well. Finally, measuring mitochondrial depolarization is accomplished with several different dyes, resulting in a different measurement for cell death. Overall, flow cytometry is an excellent tool for measuring cell death, and these assays are amenable to being performed in conjunction with immunophenotyping. These three assays are just a sampling of the many other assays that can be used. So explore the world of cell death with confidence.
To learn more about the 3 Ways To Measure Cell Death With Flow Cytometry, and to get access to all of our advanced materials including 20 training videos, presentations, workbooks, and private group membership, get on the Flow Cytometry Mastery Class wait list.

ABOUT TIM BUSHNELL, PHD
Tim Bushnell holds a PhD in Biology from the Rensselaer Polytechnic Institute. He is a co-founder of—and didactic mind behind—ExCyte, the world’s leading flow cytometry training company, which organization boasts a veritable library of in-the-lab resources on sequencing, microscopy, and related topics in the life sciences.
More Written by Tim Bushnell, PhD


