2 Key SPADE Parameters To Adjust For Best Flow Cytometry Results

Mass cytometry panels routinely include 30 or more markers, but traditional analysis methods like bivariate gating can’t adequately parse the resulting high-dimensional data.

Spanning-tree progression analysis of density-normalized events (SPADE) is one of the most commonly used computational tools for visualizing and interpreting data sets from mass cytometry and multidimensional fluorescence flow cytometry experiments.

There are two key parameters in SPADE that you can adjust in order get the best results possible: downsampling and target number of nodes, or k. Knowing how to properly set these values will enable you to enhance the quality of your analysis.

Downsampling

Imagine your data as a cloud of points in high dimensional space, where each dimension is one of the measured markers.

Cells that are similar to each other are close to one another in this cloud, just as similar cells fall together on a biaxial gating plot. This means that the cloud contains dense regions where there are groups of similar cells, and more sparsely populated regions where there are few similar cells.

The cells falling around the edges of dense regions will likely be grouped into the larger clusters during analysis, even if some of the sparse regions contain cell subsets that happen to be small but phenotypically distinct.

Downsampling in the SPADE algorithm reduces the density variation across the cloud in order to give more equal weight to small, less dense groups of cells in the clustering process so they won’t get absorbed into the larger, denser regions.

After downsampling, SPADE clusters the data and then upsamples, in order to map the cells that were removed during downsampling, back into the clusters to which they are most similar.

You can adjust the extent of downsampling by changing the percentage or absolute number. The percentage indicates the percentage of cells you want to keep during the downsampling process.

100% downsampling means that 100% of the cells will be kept, and therefore SPADE will not downsample. 5% downsampling means that only 5% of the cells will be kept for clustering. Lowering the downsampling percentage in this way prevents small or rare populations of cells from being lost in the clustering step.

If you set an absolute number, rather than a percentage, SPADE downsamples until this number of cells remains.

If you’re working with a limited number of relatively large populations, like normal blood cells, you can probably safely leave the downsampling percentage set to the default. However, if you are seeking novel populations of cells, or very small populations like stem cells, you should consider setting the downsampling to a lower percentage in order to prevent losing those populations during clustering (Figure 1).

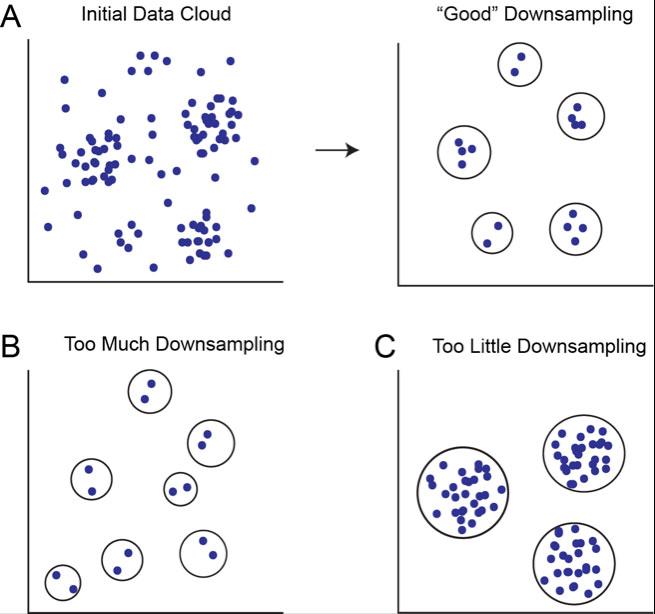
Figure 1. Downsampling removes density variation to determine which regions of the point cloud constitute discrete clusters. A) Initial data cloud in n dimensions shown before and after appropriate downsampling, assuming five real cell populations in the data. B) Clusters determined after too much downsampling. Low density regions are inappropriately considered to be discrete clusters. C) Clusters determined after too little sampling. Only high density regions are considered to be clusters.

An important consideration is that when you set the downsampling percentage very low, you risk focusing on noise in the data. Sparse regions in the high dimensional cloud might be treated as discrete clusters, when in reality, they represent nothing more than noise.

On the other hand, if you set the downsampling percentage too high, or if you don’t downsample at all, you risk overlooking smaller, “real” populations of cells.

Target Number of Nodes (k)

The second parameter that you can adjust in a SPADE analysis is the target number of nodes, or k. This value indicates the number of populations into which you want SPADE to divide the cells.

Keep in mind that this number is a target, not an exact value, so you may notice empty clusters in the final output if SPADE couldn’t find exactly k number of clusters in the data.

A good rule of thumb is to always ask SPADE for more nodes, or clusters, than you expect to find.

Overclustering in this way allows you to identify potentially unexpected subpopulations that are defined by subtle, high-dimensional patterns of marker co-expression (for example, small subpopulations of T cells in normal blood that are defined by subtle differences in their co-expression of several activation markers).

Additionally, overclustering helps you delineate between major populations because when the SPADE tree is populated by more nodes, it is easier to visualize and determine more precisely where one major population, or group of nodes, ends and another begins.

When choosing k, you should consider how many populations you expect to find, the relative size of those populations, and the total number of cells in the data set.

If you ask SPADE for 500 clusters but only have 1,000 cells and 5 major populations, you’ll probably get back lots of empty clusters as well as clusters with only a few cells each.

It’s crucial to consider the biological implications of what you put into SPADE, and what you get back. For example, is a population of T cells that only has 3 out of the 1,000 cells “real” or significant?

Knowing your data and your biological system can help you decide appropriate cut-offs for k values, as well as what population sizes are likely to be biologically valid, versus just noise.

Another consideration is that small subsets resulting from high cluster numbers can also be more unstable, meaning that the cells’ phenotypic similarity is so subtle that another round of clustering might group them differently, and thus you may find that these populations won’t hold up to further computational or experimental scrutiny.

Conversely, setting k too low can cause you to miss smaller populations, as they’re likely to be merged into the larger, denser clusters of cells (Figure 2).

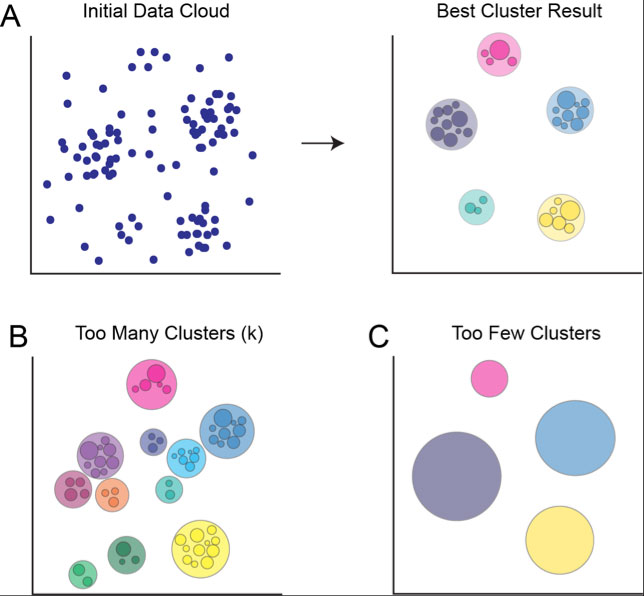
Figure 2. Target number of nodes (k) affects the number of clusters returned by SPADE. A) Initial data point cloud before and after clustering using appropriate target number of nodes, assuming five real populations of cells in the data. Data is properly overclustered, allowing analyst to manually delineate between major populations. B) Clustering result if target number of nodes is too high. Major populations appear to contain multiple clusters, and lower density regions are designated as discrete clusters, containing very few cells. C) Clustering result if target number of nodes is too low. All cells are grouped into a few large clusters, obscuring smaller populations of cells.

Fine-tuning your SPADE analysis requires a k value and downsampling percentage that will identify small, rare cell populations without blowing out noise in the data.

Going forward with your analysis, it’s always crucial to experimentally validate novel populations that you have discovered, using SPADE or other computational methods.

For further reading, see: Qui, et al. Extracting a cellular hierarchy from high-dimensional cytometry data with SPADE. Nature Biotechnology, 2011.

To learn more about 2 Key SPADE Parameters To Adjust For Best Flow Cytometry Results, and to get access to all of our advanced materials including 20 training videos, presentations, workbooks, and private group membership, get on the Flow Cytometry Mastery Class wait list.

Join Expert Cytometry's Mastery Class

ABOUT TIM BUSHNELL, PHD

Tim Bushnell holds a PhD in Biology from the Rensselaer Polytechnic Institute. He is a co-founder of—and didactic mind behind—ExCyte, the world’s leading flow cytometry training company, which organization boasts a veritable library of in-the-lab resources on sequencing, microscopy, and related topics in the life sciences.

Tim Bushnell, PhD

Similar Articles

Common Numbers-Based Questions I Get As A Flow Cytometry Core Manager And How To Answer Them

Common Numbers-Based Questions I Get As A Flow Cytometry Core Manager And How To Answer Them

By: Tim Bushnell, PhD

Numbers are all around us.  My personal favorite is ≅1.618 aka ɸ aka ‘the golden ratio’.  It’s found throughout history, where it has influenced architects and artists. We see it in nature, in plants, and it is used in movies to frame shots. It can be approximated by the Fibonacci sequence (another math favorite of mine). However, I have not worked out how to apply this to flow cytometry.  That doesn’t mean numbers aren’t important in flow cytometry. They are central to everything we do, and in this blog, I’m going to flit around numbers-based questions that I have received…

How To Do Variant Calling From RNASeq NGS Data

How To Do Variant Calling From RNASeq NGS Data

By: Deepak Kumar, PhD

Developing variant calling and analysis pipelines for NGS sequenced data have become a norm in clinical labs. These pipelines include a strategic integration of several tools and techniques to identify molecular and structural variants. That eventually helps in the apt variant annotation and interpretation. This blog will delve into the concepts and intricacies of developing a “variant calling” pipeline using GATK. “Variant calling” can also be performed using tools other than GATK, such as FREEBAYES and SAMTOOLS.  In this blog, I will walk you through variant calling methods on Illumina germline RNASeq data. In the steps, wherever required, I will…

Understanding Clinical Trials And Drug Development As A Research Scientist

Understanding Clinical Trials And Drug Development As A Research Scientist

By: Deepak Kumar, PhD

Clinical trials are studies designed to test the novel methods of diagnosing and treating health conditions – by observing the outcomes of human subjects under experimental conditions.  These are interventional studies that are performed under stringent clinical laboratory settings. Contrariwise, non-interventional studies are performed outside the clinical trial settings that provide researchers an opportunity to monitor the effect of drugs in real-life situations. Non-interventional trials are also termed observational studies as they include post-marketing surveillance studies (PMS) and post-authorization safety studies (PASS). Clinical trials are preferred for testing newly developed drugs since interventional studies are conducted in a highly monitored…

How To Profile DNA And RNA Expression Using Next Generation Sequencing (Part-2)

How To Profile DNA And RNA Expression Using Next Generation Sequencing (Part-2)

By: Deepak Kumar, PhD

In the first blog of this series, we explored the power of sequencing the genome at various levels. We also dealt with how the characterization of the RNA expression levels helps us to understand the changes at the genome level. These changes impact the downstream expression of the target genes. In this blog, we will explore how NGS sequencing can help us comprehend DNA modification that affect the expression pattern of the given genes (epigenetic profiling) as well as characterizing the DNA-protein interactions that allow for the identification of genes that may be regulated by a given protein.  DNA Methylation Profiling…

How To Profile DNA And RNA Expression Using Next Generation Sequencing

How To Profile DNA And RNA Expression Using Next Generation Sequencing

By: Deepak Kumar, PhD

Why is Next Generation Sequencing so powerful to explore and answer both clinical and research questions. With the ability to sequence whole genomes, identifying novel changes between individuals, to exploring what RNA sequences are being expressed, or to examine DNA modifications and protein-DNA interactions occurring that can help researchers better understand the complex regulation of transcription. This, in turn, allows them to characterize changes during different disease states, which can suggest a way to treat said disease.  Over the next two blogs, I will highlight these different methods along with illustrating how these can help clinical diagnostics as well as…

What Is Next Generation Sequencing (NGS) And How Is It Used In Drug Development

What Is Next Generation Sequencing (NGS) And How Is It Used In Drug Development

By: Deepak Kumar, PhD

NGS methodologies have been used to produce high-throughput sequence data. These data with appropriate computational analyses facilitate variant identification and prove to be extremely valuable in pharmaceutical industries and clinical practice for developing drug molecules inhibiting disease progression. Thus, by providing a comprehensive profile of an individual’s variome — particularly that of clinical relevance consisting of pathogenic variants — NGS helps in determining new disease genes. The information thus obtained on genetic variations and the target disease genes can be used by the Pharma companies to develop drugs impeding these variants and their disease-causing effect. However simple this may allude…

7 Key Image Analysis Terms For New Microscopist

7 Key Image Analysis Terms For New Microscopist

By: Heather Brown-Harding, PhD

As scientists, we need to perform image analysis after we’ve acquired images in the microscope, otherwise, we have just a pretty picture and not data. The vocabulary for image processing and analysis can be a little intimidating to those new to the field. Therefore, in this blog, I’m going to break down 7 terms that are key when post-processing of images. 1. RGB Image Images acquired during microscopy can be grouped into two main categories. Either monochrome (that can be multichannel) or “RGB.” RGB stands for red, green, blue – the primary colors of light. The cameras in our phones…

We Tested 5 Major Flow Cytometry SPADE Programs for Speed - Here Are The Results

We Tested 5 Major Flow Cytometry SPADE Programs for Speed - Here Are The Results

By: Tim Bushnell, PhD

In the flow cytometry community, SPADE (Spanning-tree Progression Analysis of Density-normalized Events) is a favored algorithm for dealing with highly multidimensional or otherwise complex datasets. Like tSNE, SPADE extracts information across events in your data unsupervised and presents the result in a unique visual format. Given the growing popularity of this kind of algorithm for dealing with complex datasets, we decided to test the SPADE algorithm in 5 software packages, including Cytobank, FCS Express, FlowJo, R, and the original, free software made available by the author of SPADE. Which was the fastest?

5 FlowJo Hacks To Boost The Quality Of Your Flow Cytometry Analysis

5 FlowJo Hacks To Boost The Quality Of Your Flow Cytometry Analysis

By: Tim Bushnell, PhD

FlowJo is a powerful tool for performing and analyzing flow cytometry experiments, if you know how to use it to the fullest. This includes understanding embedding and using keywords, the FlowJo compensation wizard, spillover spreading matrix, FlowJo and R, and creating tables in FlowJo. Extending your use of FJ using these hacks will help organize your data, improve analysis and make your exported data easier to understand and explain to others. Take a few moments and explore all you can do with FJ beyond just gating populations.

Top Industry Career eBooks

Get the Advanced Microscopy eBook

Get the Advanced Microscopy eBook

Heather Brown-Harding, PhD

Learn the best practices and advanced techniques across the diverse fields of microscopy, including instrumentation, experimental setup, image analysis, figure preparation, and more.

Get The Free Modern Flow Cytometry eBook

Get The Free Modern Flow Cytometry eBook

Tim Bushnell, PhD

Learn the best practices of flow cytometry experimentation, data analysis, figure preparation, antibody panel design, instrumentation and more.

Get The Free 4-10 Compensation eBook

Get The Free 4-10 Compensation eBook

Tim Bushnell, PhD

Advanced 4-10 Color Compensation, Learn strategies for designing advanced antibody compensation panels and how to use your compensation matrix to analyze your experimental data.