How to Perform Doublet Discrimination In Flow Cytometry

What is doublet discrimination?
You are probably familiar with the term, “doublet discrimination” or “doublet exclusion”, and have likely included this flow cytometry measurement into at least some (if not all) of your gating strategies.
Even though you may utilize this important gating strategy, you may not have had the chance to delve deeper to explore exactly what doublets are and why it’s critical to exclude them. This article aims to do just that.
What is doublet discrimination?
The first aspect to understanding how a doublet exclusion gate works is to define what a doublet is. Most straightforwardly, a doublet is a single event that actually consists of 2 independent particles.
The cytometer classified these particles as a single event because they passed through the interrogation point very close to one another. In other words, the particles were so close together when they passed through this laser spot, that the instrument was incapable of distinguishing them as individual events or particles.
Given how good cytometers are at measuring single cells, how would a situation arise in which the instrument would not be able to do this? The answer to this question has a whole lot to do with cytometer electronics, and how they classify cells and other particles as events.
You may recall that an “event” is the fundamental unit of measurement in flow cytometry, and is defined by what we call a pulse. Pulses occur as a cell pass through the laser beam spots, and this passage generates signal from the detectors. This signal is monitored and processed by the cytometer’s electronics, and is the origin of the “A”, “H”, and “W” pulse parameters we know and love (Figure 1).
In the absence of a cell in a laser beam, the output of the detectors is not 0 but rather a low and constant level — a background “hum,” if you will — and is interpreted by the cytometer electronics as what we call the baseline.

Figure 1. Anatomy of the voltage pulse.
In order for something to actually be considered an event, a few things have to happen. First, the detectors have to generate signal.
Usually, this occurs when a cell or other particle passes through the laser beam. However, signal can also be of a more displeasing nature, including an extraordinarily high PMT voltage (effectively amplifying the baseline “hum” generates events itself), or perhaps errant laser light escaping into the detector.
Second, this signal needs to cross what we call the “threshold” in the “trigger” channel. The threshold is the fine line between being an event and not being an event. Any pulse that fails to cross this line in the trigger channel is not considered to be relevant, and is ignored by the electronics.
What happens at the threshold is similar to what happens when you blow bubbles with a wand, like we did as kids. If you blow only slightly on the wand, a bubble may pucker but not enough to actually escape as a discrete unit. However, if you blow strongly enough (i.e. the signal is intense enough), that bubble will “pass the threshold” and escape into a fully fledged one (a pulse).
Third, the signal needs to drop back down to baseline. It is based on this third criterion that a doublet can occur. If 2 cells pass through the trigger laser so close together that the pulse does not fall back to baseline between them, the cytometer assumes their 2 pulses actually belong to one particle and will classify them as such: one, single, large event (Figure 2).

Figure 2. Voltage pulse of a doublet event.
Why perform doublet discrimination?
These doublets can have some negative effects on results and data. Most critically, they wreak havoc when sorting. Failure to include doublet exclusion in your gating strategy is a sure way to end up with poor purity.
When 2 events, one a target event for sorting and the other a non-target event, comprise a doublet, BOTH will be sorted and purity will suffer. For sorts that require extra stringency in purity, 2 individual doublet exclusion strategies can be used, which we will discuss shortly.
The importance of excluding doublets is certainly not restricted to sorting. When identifying subpopulations for analysis, the presence of doublets can impact population frequency, which can in turn impact how the data is collected. If a doublet consists of a CD4+ cell and a CD4- cell, the event they comprise will be classified as CD4, skewing the CD4+ percentage.
Additionally, doublets can make for some very strange staining patterns. If a doublet consists of one CD4+ cell and another CD8+ cell, you may mistake this data artifact with the presence of a rare CD4+CD8+ population.
Finally, including a plot that serves as a doublet exclusion can also give you a sense of both how sticky your sample is, as well as the general quality of your sample preparation. For example, lots of doublets may indicate poor enzymatic digestion.
How to perform double discrimination
So, how do you actually identify and exclude doublets? The answer to this question can be gleaned from taking a deeper look at pulses. Let’s revisit what a doublet pulse looks like in comparison to that of a single particle (Figure 3).
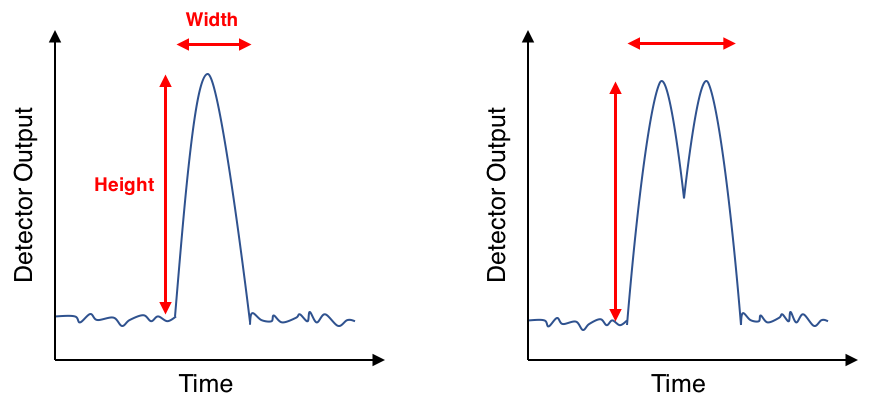
Figure 3. Voltage pulses for single (left) and doublet (right) events.
Notice the differences between the doublet pulse and the single particle pulse: both the area and the width of the doublet pulse are larger than the single cell’s (because two cells spend longer passing through a laser beam than one cell) but the heights of the two pulses are very close, if not identical. We can take advantage of these observations to parse out which pulses belong to doublets and which belong to true single events in the data set.
There are a few things that we need to do to accomplish this. First, we have to choose a channel in which to compare area, height, and width measurements to each other. The only requirement for this channel is that it should be scaled linearly.
The magnitude of difference in any pulse parameter between a doublet and single event is not large, and the resolution of linear scale is necessary to be able to accurately identify doublets to exclude. This requirement precludes most fluorescent parameters, which are typically scaled logarithmically, leaving forward and side scatter (which are coincidentally also nice and bright signals) as the best choices.
One exception is when performing cell cycle analysis by DNA measurement. In this case, the DNA dye measurement will be scaled linearly, and this channel is often the best choice for a doublet exclusion.
Next, we need to set up plots to make the determination. This is done in a variety of ways, and the method that is chosen is often based on personal preference. The most typical plots are based on forward scatter, as the chart below indicates, but side scatter can also be a good choice.
| X-axis | Y-axis |
| FSC-Area | FSC-Height |
| FSC-Area | FSC-Width |
| FSC-Height | FSC-Width |
The final step is to identify doublets, draw a region around the single cells to exclude those doublets, and gate all subsequent analysis on this region. Depicted below are some typical plots and where doublets can be found (Figure 4).
One important tip: if you are using BD “digital” FACSDiva instrumentation, the pulse width parameter is not really measured, but is calculated from the pulse area. Therefore, in order to ensure an accurate doublet exclusion gate, be sure to calibrate the Area Scaling Factor associated with the doublet discrimination parameter if you intend to use the width pulse parameter for doublet exclusion.
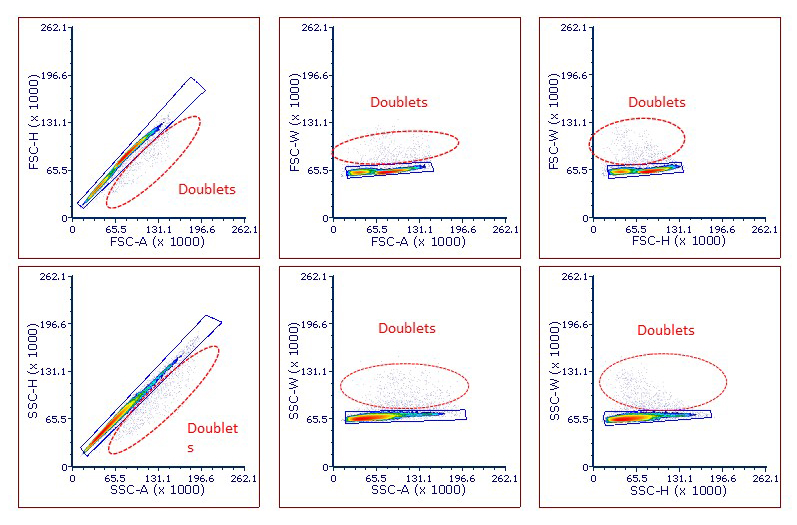
Figure 4: Examples of different methods for excluding doublets
You may also be wondering whether implementing a tighter, more restrictive forward and side scatter gate may preclude the need to include a formal doublet exclusion gate. While some doublets can be identified by a forward and side scatter plot, not all can, especially when cells are irregularly shaped or the sample preparation is heterogenous, so it’s not worth the risk.
One final point. Don’t necessarily conclude that the presence of doublets in a sample reflects poor sample quality. Doublets are inevitable; even the best cell preparations contain them. Their presence is a function of a random distribution and, considering that flow cytometry and cell sorting are all about random distributions, inevitable. Some cells will just end up close enough to one another to produce a doublet, even in a suspension that consists entirely of single cells. The faster that cells are pushed through the system and the more dense the sample, the higher the frequency of doublets. So, don’t fret — just gate them out.
That’s about it! We hope you now have an appreciation of what doublets are, in terms of the instrumentation, and how and why to make sure they are excluded when analyzing a data set.
To learn more about How to Perform Doublet Discrimination In Flow Cytometry, and to get access to all of our advanced materials including 20 training videos, presentations, workbooks, and private group membership, get on the Flow Cytometry Mastery Class wait list.

ABOUT TIM BUSHNELL, PHD
Tim Bushnell holds a PhD in Biology from the Rensselaer Polytechnic Institute. He is a co-founder of—and didactic mind behind—ExCyte, the world’s leading flow cytometry training company, which organization boasts a veritable library of in-the-lab resources on sequencing, microscopy, and related topics in the life sciences.
More Written by Tim Bushnell, PhD


