5 Steps For Accurate Flow Cytometry Statistical Analysis Results

At the end of many experiments, the question of statistical analysis rears its ugly head. When it comes up, many researchers freeze not knowing how to proceed, and they muddle through as best they can. With some proper planning and forethought, this doesn’t have to be the case.
To resolve this analysis dilemma, it is important to begin thinking about the statistical analysis during the initial designing of the experiments.
This is where some critical decisions need to be made to ensure that, if there are statistically significant findings to be uncovered, the data will be sufficient to support them.
During initial experiment design, consider the following…
1. Power the flow cytometry experiment properly.
Simply put, the statistical power of an experiment is the likelihood that the experiment will detect an effect if there is one to be measured.
The higher the experiment is powered, the lower the chance of making a Type II (false negative) statistical error.
There are a variety of calculators out there and one of the most useful is Statmate, from GraphPad software. Although those using OSX are out of luck with the package, it is a great program to add to your toolkit.
To use this tool, one needs to determine the statistical test to be performed, the threshold (α), and the standard deviation. With this information, a table such as the one shown below is generated.
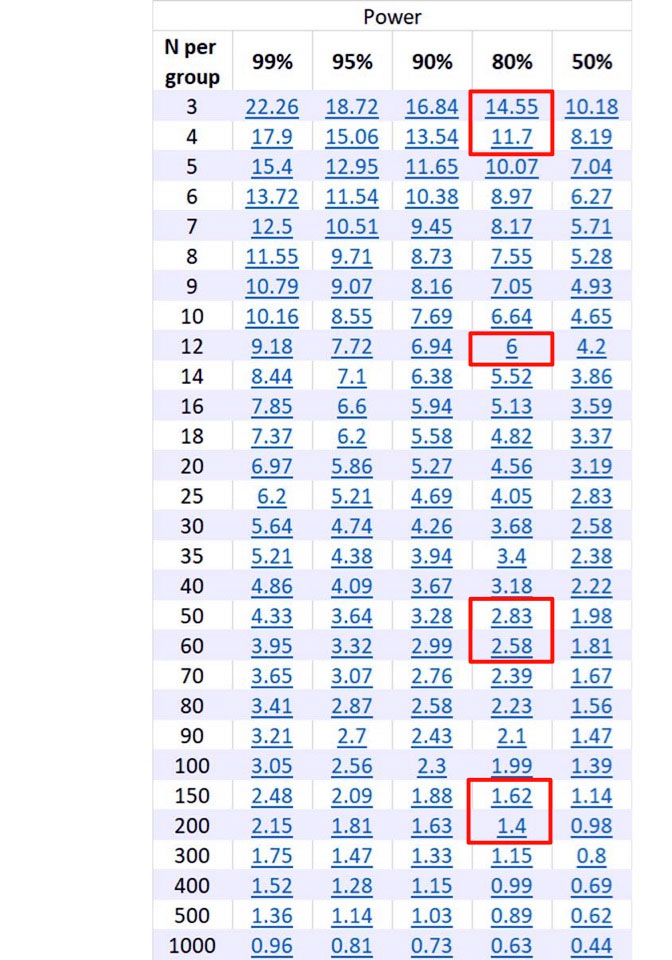
Figure 1: Output from Statmate.
Across the top are columns for different power, and down the side are the number of samples per group.
The numbers in blue represent the difference between the means between the control and experimental sample.
To use the chart, calculate the difference between the experimental and control means, and consult the blue numbers under the column of the power for the experiment.
Cross-referencing the blue number under the power to the number of samples per group will give you the number of samples needed to be run for the appropriate power.
Setting the power at the beginning of the experiment is the best practice and will provide the researcher with confidence on the possibility of finding a statistically significant result if there is one to be discovered.
2. Establish the threshold (significance level) to your statistical test.
The threshold, denoted as the α, is the probability level below which the null hypothesis will be rejected.
This value is historically set at 0.05%.
This value is also related to the possibility of making a Type I (false positive) statistical error and is based on work by Roland Fisher from the 1920s, which he suggested was a “convenient cut-off to reject the null hypothesis.”
Consider the normal distribution, as shown below. If a two-tailed T-test is performed on the data, with a threshold of 0.05%, this is distributed evenly above and below the mean. The white areas represent that 5%.
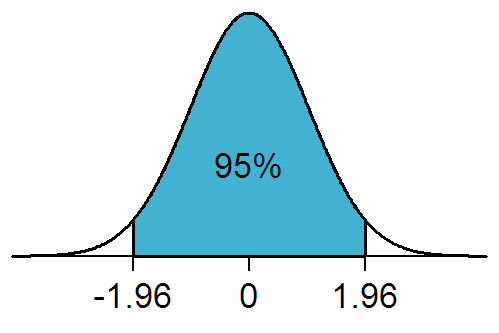
Figure 2: From https://en.wikipedia.org/wiki/File:NormalDist1.96.png used under the GNU Free Documentation License.
The P value will be compared to the α to determine if the the null hypothesis can be rejected or not.
Since the α is a measure of committing a Type I error, the consequences of a false positive must be considered when establishing the threshold.
A higher threshold makes it easier to find significance, but increases the possibility of the Type I error.
Lower the threshold and it decreases the possibility of a Type I error. Thus, setting the threshold should be considered based on the specific conditions of the test.
Setting the threshold at the beginning of the experiment is a best practice, as it helps establish the probability of committing a Type I error.
3. Clearly state the hypothesis.
At the beginning of the experimental planning, it is critical to understand what the hypothesis being tested is.
If the hypothesis is poorly stated, the rest of the statistical analysis will be inaccurate, or as it is said ‘Garbage In, Garbage Out.’
Since the hypothesis will be used to establish the null hypothesis (H0), this becomes the most important step in the process, as it forms the basis of why the experiments are being performed.
For example, when asked to determine if a new drug, Pescaline D, increases the number of CD4+ T-cells in patients with Bowden’s malady, one can design an appropriate experiment.
The null hypothesis for this experiment could be stated as: Pescaline D causes no change to the percent of CD4+ cells in patients suffering from Bowden’s Malady.
Setting the null hypothesis at the beginning of the experiment will assist in the design of the experiment, help evaluate the best controls to use, and guide the direction of the statistical test.
4. Choose the correct statistical test.
The statistical test should be identified at the beginning of the experiment.
Based on the null hypothesis, the correct testing method should be clear.
Some common statistical tests, and when they should be used, are listed here:
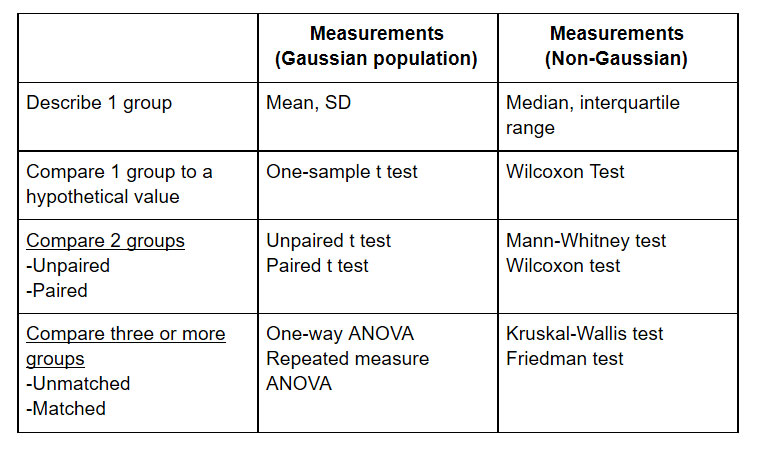
Figure 3: Suggested statistical testing. A more complete list can be found here: http://www.graphpad.com/support/faqid/1790/
This choice will influence the data that is extracted from the primary analysis.
In the case of the example above, the data would be the percentage of CD4+ cells between the control (untreated) and experimental (treated).
This would be tested using an unpaired T-Test. However, if the experimental design was to take a sample before treatment (control) and treat the patient (experimental), one would perform a paired T-Test.
For those performing T-tests, another consideration is whether to do the test as a ‘one-tailed’ or ‘two-tailed’ T-test.
This is another consideration that has to be made before the experiments are performed.
If the expected change is in one direction — that is, there will be an increase or a decrease — then a one-tailed T-test is appropriate.
On the other hand, if it is not known which direction the change will occur, a two-tailed T-test is the best test to choose. This is defined at the beginning of the experiment to avoid the desire to look at the data and choose a one- or two- tailed T-test at the end.
Choosing the appropriate statistical test at the beginning of the experimental design process is the best practice to prevent bias.
This will ensure that there is no experimenter bias introduced after the data is collected and will also ensure the correct data is extracted from the primary analysis.
5. Know how to plot your data and do it first.
Although it may sound strange, it is very valuable to plot your data before you move forward with your statistical analysis.
Back in 1973, the statistician Francis Anscombe published the now famous Anscombe’s quartet:
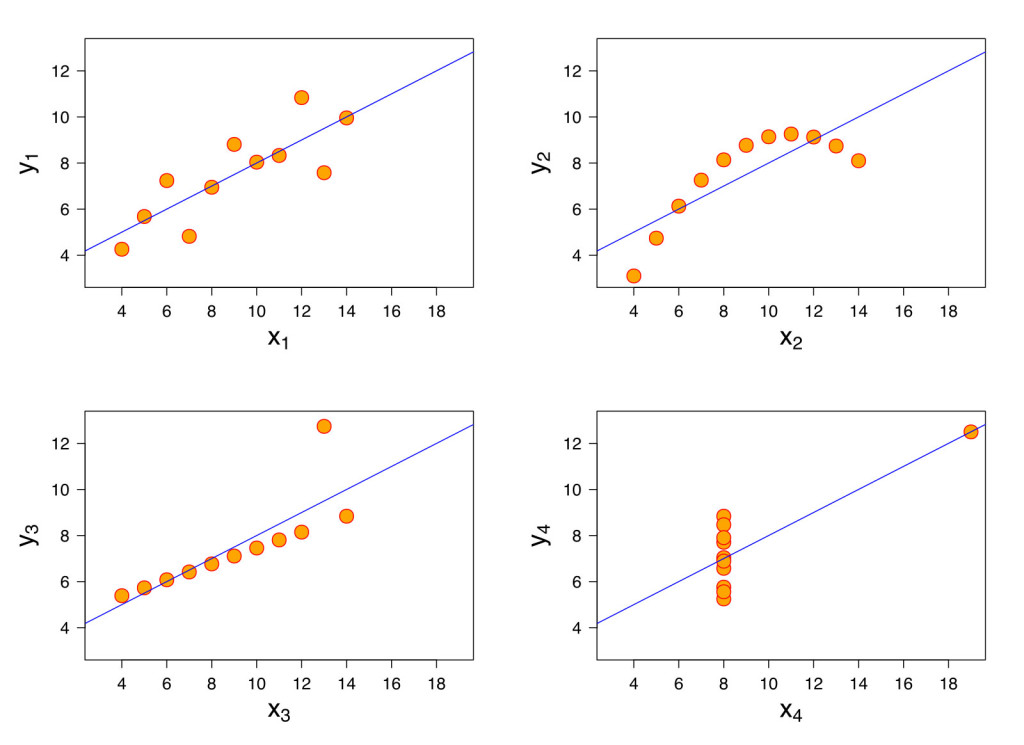
Figure 4: Anscombe’s quartet. From: https://commons.wikimedia.org/wiki/File:Anscombe%27s_quartet_3.svg used under GNU General Public License.
These four datasets are statistically identical: including the mean, the sample variance, the regression line, and the correlation coefficient.
Anscombe published this dataset when many researchers were starting to use computers for their statistical analysis, and entering data without graphing it. This dataset was designed to point out the fact that graphing data is a critical first step and an important check on the researcher as well. If something looks odd, it may be odd.
When plotting data, it is good practice to use a plot that shows all the data points.
Take a look at these two graphs.
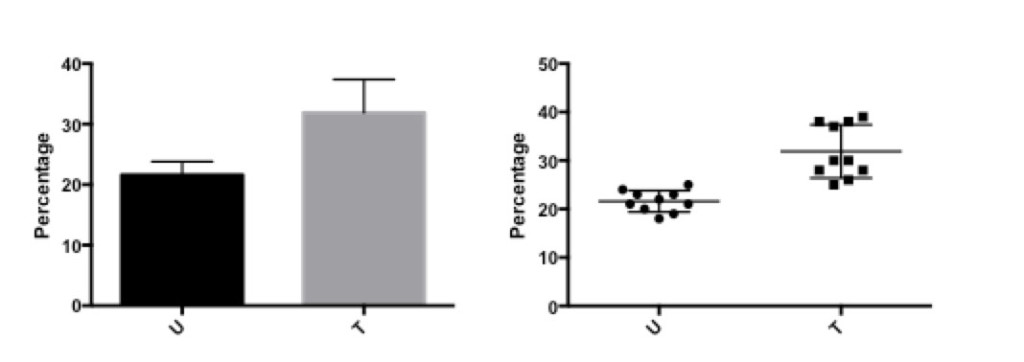
Figure 5: Percentage of CD4+ cells before (U) and after (T) treatment.
The bar graph on the left shows the same data as the scatter graph on the right.
The difference is that with the scatter graph, it is possible to see that there are two different levels of response in the data after treatment, which is lost in the bar graph. Thus, some data is hidden or not fully evaluated with the bar graph that is visualized with the scatter graph.
Knowing the best graph to use is an important way to convey the important information and supports the statistical analysis that is performed on the data.
It is critical to prepare for your statistical analysis at the beginning of the experimental design process. This will ensure the correct data is extracted, the proper test applied, and that sufficient replicates are obtained so that if an effect is to be found, it will be found. Don’t rely on some magic number of events or samples to determine your experimental design. Rather, rely on the best statistical methods and comparisons to appropriate controls to ensure your data stands up to review.
To learn more about 5 Steps For Accurate Flow Cytometry Statistical Analysis Results, and to get access to all of our advanced materials including 20 training videos, presentations, workbooks, and private group membership, get on the Flow Cytometry Mastery Class wait list.

ABOUT TIM BUSHNELL, PHD
Tim Bushnell holds a PhD in Biology from the Rensselaer Polytechnic Institute. He is a co-founder of—and didactic mind behind—ExCyte, the world’s leading flow cytometry training company, which organization boasts a veritable library of in-the-lab resources on sequencing, microscopy, and related topics in the life sciences.
More Written by Tim Bushnell, PhD


