7 Advanced Flow Cytometry Data Analysis Tips For Multi-Color Experiments

There was a time when two- and three-color experiments were considered very complex flow cytometry experiments.
A limited number of dyes and light sources meant a limited number of options overall.
In fact, the first experiments sorting cells with fluorescently-labeled antibodies were performed by Len Herzenberg in 1972 and could only detect fluorescence from an Argon laser source above 530 nm. These early experiments were performed using rhodamine- and fluorescein-tagged antibodies.
Times have changed. Now, we have spatially separated lasers and a seemingly unlimited number of dyes.
From 2-Colors To 10-Colors
Not long after Herzenberg’s work, Howard Shapiro began designing a series of multiparameter instruments. While instrumentation was evolving, there was parallel development in fluorescent colors to allow for detection of more antigens.
For example, the patent for the phycobiliprotein uses in FACS and other applications was issued to Glazer, Oi, and Stryer in 1995. Then, in the early 2000’s, Alexa Fluor dyes came onto the scene.
In today’s world, many scientists have access to instruments capable of running multi-color experiments with 10 or more colors.
The leap from 2 to 10 may seem small, but there are many factors to consider in the design and analysis of experiments that make full use of instruments that can handle these additional colors.
Each additional fluorochrome (potentially) affects each other fluorochrome, which makes your analysis more and more complex.
7 10-Color Flow Cytometry Tips
Imagine analyzing a 2-color experiment. With 2 biaxial plots and a single quadrant gate, you have only 4 populations to report.
Now add a 3rd color. By doing so, you’ve increased your population count to 8. With 4-colors, you’ve increased your population count to 16.
On and on it goes until you get to 10-colors. Now you have 1024 possible combinations!
With this kind of complexity, careful experimental planning is not a luxury, it’s a necessity. Here are 7 tips for preparing and analyzing 10-color flow cytometry experiments…
1. Understand compensation and data spread.
To build a 10-color panel, you’re going to have to put more than one color on a single laser line and its detectors. This means you will have to perform compensation. There’s no way to avoid it.
The key point to emphasize for these complex experiments is that compensation reveals spread in your data. The spread can make it more difficult to separate dim positive signals from negative signals.
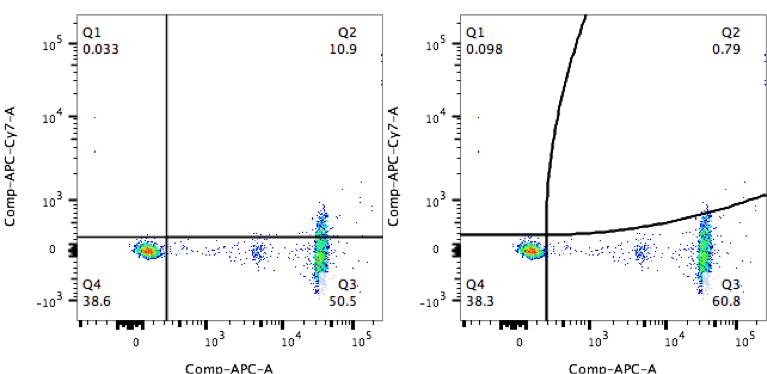
This can be observed in very simple examples, such as the one below where antibody capture beads have been properly compensated with an APC-conjugated antibody. Using a straight quadrant gate based on the unstained bead population, the user mistakenly identifies 10% of those beads as APC-Cy7 positive.
The true shape of the data is better matched with a curved quadrant that takes into account the spread in the APC-Cy7 channel.
2. Remember to consider fluorochrome brightness and antigen density.
For most experiments, it’s important to pair your lowest expressing targets with your brightest fluorochromes. This is all the more important when doing 10-color experiments.
As mentioned in point #1 above, compensation creates spread in your data. If you make the mistake of placing a lowly expressing marker on a channel with many overlapping signals, it will be very difficult to resolve the resulting dimly positive signal. Even highly expressed antigens become more difficult to discern the more colors you add to your experiment.
3. Use FMO controls to help deal with spectral overlap.
The best way to deal with the spread associated with spectral overlap in multi-color experiments is to make liberal use of Fluorescence Minus One, or FMO controls. Not only do FMO controls save you from drawing incorrect gates, they can save you from poorly compensated data.
In the example below (courtesy of Bridget McLaughlin, UC Davis Core Facility), pay particular attention to the plot showing the activation of CD8+ cells. As the note in this area of the plot indicates, it can be very difficult to plot’s quadrants, as they do not separate as clearly as the plots of the mature cells. FMOs are critical for removing ambiguity and human error during the data analysis portion of your experiment.

4. Use biological controls where appropriate.
If your 10-color panel includes cell signaling or other intracellular staining, make sure you include an unstimulated control along with your FMO control. Very often, there will be baseline expression levels of cytokines and/or phosphoproteins in your cells. The FMO will allow you to determine this baseline level of activity, while the biological control allows you to see the effect of your treatment.
5. Gate out populations before gating on your population of interest.
Once you begin analyzing your data, try not to go get locked into looking at your data in one way. The fact that you know exactly what you’re looking for can limit your perspective.
For example, if you’re interested in a B cell population, don’t just gate on your B cells, analyze them, and call it a day. Instead, try gating out the populations you’re not interested in first.
Returning to our example, if you’re interested in B cells, gate out T cells first, then look at the population again. Next, gate out monocytes, then look at your population again. You might be surprised by what you discover.
Cells of different shapes and sizes can have different levels of autofluorescence so removing them from further analysis can allow you to be more aggressive in gating for dim levels of other markers.
6. Trying multiple combinations of dyes to get the best results.
For most 10-color experiments, you should try several combinations of fluorochromes to get the best possible separation of signals.
You can make several inferences about which marker should be placed on which fluorochrome using what you know about your experiment, sample type, and instrument configurations. Still, during the experiment itself, thing may not come out as predicted by your design.
As seen in the example below (courtesy of Mario Roederer, National Institutes of Health), it can be very helpful to try out a few combinations of staining cocktails during the initial set-up of your experiment to ensure the populations of interest will be well-defined. Depending on what fluorochrome is used for these 2 markers you can completely lose resolution of the 4 populations, or make it very easy to see.

7. Use OMIPs as a starting point for your experiment.
By looking in the OMIPs section in Cytometry A, you will find validated protocols you can use as a backbone for your own experiments.
One thing you will notice is that OMIPs are short and direct. This is what makes them such a great resource—you don’t have to dig around in the text and methods sections of papers to see what was done.
OMIPs provide figures with examples of all gates already drawn and the purpose of each gate, a summary describing the purpose of the panel and cross-referencing each panel to similar OMIPs, a short background discussion of why certain markers were used or not used, and finally, a reagent list.
The trend of the last 4 decades of flow cytometric instrumentation has been toward more colors for less money. However, this has also made it easier to generate ugly-looking data that is difficult to interpret and even more difficult to publish. When your own multi-color experiments start calling for more and more antigens in your design apply these tips and waste no time, money, and effort on bad data.
To learn more about performing 10+ color experiments and to get access to all of our advanced materials including 20 training videos, presentations, workbooks, and private group membership, get on the Flow Cytometry Mastery Class wait list.

ABOUT TIM BUSHNELL, PHD
Tim Bushnell holds a PhD in Biology from the Rensselaer Polytechnic Institute. He is a co-founder of—and didactic mind behind—ExCyte, the world’s leading flow cytometry training company, which organization boasts a veritable library of in-the-lab resources on sequencing, microscopy, and related topics in the life sciences.
More Written by Tim Bushnell, PhD


