Why Recovery, NOT Purity, Is The Best Measure Of A Cell Sorting Performance

One of the best perks of being a part of the flow cytometry community is the opportunity to attend one of the many regional flow meetings.

The chance to network with colleagues that do what you do is incredibly energizing. 

It’s also a great opportunity to see what new research ideas they’re involved in before they’re published, and to talk with them directly about their ideas, and the research they’re involved in. I was recently at the Australasian Cytometry meeting and had a chance to talk to Dr. Rui Gardner, the Director of Flow Cytometry at the Gulbenkian Institute of Science in Lisbon, Portugal.

Rui gave a great talk on the concept of Rmax, which I’ll be talking about here.  I want to make sure and acknowledge the other colleagues also involved in this work, who are Andy Riddell, Flow Cytometry Manager at Wellcome Trust-MRC Stem Cell Institute, Centre for Stem Cell Research University of Cambridge;  Alexis Perez Gonzalez, Manager Flow Cytometry Core Facility, EMBL in Heidelberg; and Lola Martinez, Head of the Flow Cytometry Facility at CNIO, Madrid, Spain.

You can find this procedure in more detail here:  https://www.youtube.com/watch?v=CUwbyuej9bA

Measuring Cell Sorter Performance

There seems to be quite a bit of confusion about how to measure the performance of a cell sorter, so I want to begin by defining a few terms, and then I want to discuss some of the variables that affect sort performance.

As a core manager for 30 years, I went through quite a transformation, as I learned that the sorter’s performance was very dependent on the sample preparation.

This is quite difficult to explain to the customer, though, so hopefully we can clear up some misconceptions. 

One of the most important metrics to customers is the sort purity.

Purity is defined as :

Purity Formula | Expert Cytometry | FlowJo SPICE Analysis

Unfortunately, purity is NOT a good measure of instrument performance.

The instrument can be performing well, and the purity will be good, and the instrument can NOT be performing well, and the purity will also be good.

If the drop delay is not calculated correctly, the purity can be good, but the recovery will suffer. 

There have been a few publications and posters on this, but it has gone largely unnoticed that measuring purity is not the best way to measure sort performance or to calculate the drop delay, but it is the method that most commercial sorters use to do this.

How do we do a better job?

Improved Recovery Formula | Expert Cytometry | FlowJo SPICE Analysis
Yield Formula | Expert Cytometry | FlowJo SPICE Analysis

Calculating Recovery, Yield & Purity

If we want to calculate the actual yield, we have a lot of counting methods, like cell counters and Neubauer chambers, but these all come with a fairly high level of associated error.

The best method would be independent of this error.

As long as we sort similar particles, which show the same Poisson behavior when sorted, the following holds.

At any given time, after a fraction α of the original sample is sorted, the absolute number of target particles (t) in this fraction (α.Ot) is distributed between the sorted tube (St) and the center stream catch (Ct) collected during the sort:

Cell Sort Formula | Expert Cytometry | FlowJo SPICE Analysis

The same applies for non-target particles where:

Non-Target Particles | Expert Cytometry | FlowJo SPICE Analysis

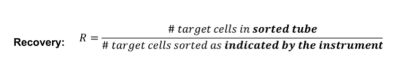
We can estimate the maximum recovery for a given set of sort conditions:

Max Recovery Sort Condition | Expert Cytometry | FlowJo SPICE Analysis

If sort purity approaches 100%, this simplifies to:

Cell Sort Purity Formula | Expert Cytometry | FlowJo SPICE Analysis

The first time I saw the above equation, I was thinking this was going to be a complicated experiment, but Rui and colleagues have given us all of the tools to make it really easy to do.

The experiment is outlined in the protocol I linked above.

Adjusting Drop Delay For Purity Versus Recovery

You set up a sort with two different particle types, and measure the proportions of each in the sort tube and the waste.

The data are entered into the spreadsheet provided, and the maximum recovery can be predicted.

By comparing the recovery and purity at the drop delay calculated by the instrument, and by sorting slightly above and below this value, you can see that the calculated drop delay is rarely the ideal for recovery.

As you can see from the graphs below, from two different instruments, the calculated delay works very well for purity, but for maximal recovery, the delay should be shifted.

BOP Delay | Expert Cytometry | FlowJo SPICE Analysis

In sum, recovery is much more sensitive to the correct calculation of the drop delay than the purity, and we should be sure we choose the correct metric for measuring sort performance.

To learn more about cell sorting and to get access to all of our advanced materials including 20 training videos, presentations, workbooks, and private group membership, get on Mastery Class wait list.

Join Expert Cytometry's Mastery Class

ABOUT TIM BUSHNELL, PHD

Tim Bushnell holds a PhD in Biology from the Rensselaer Polytechnic Institute. He is a co-founder of—and didactic mind behind—ExCyte, the world’s leading flow cytometry training company, which organization boasts a veritable library of in-the-lab resources on sequencing, microscopy, and related topics in the life sciences.

Tim Bushnell, PhD

Similar Articles

Common Numbers-Based Questions I Get As A Flow Cytometry Core Manager And How To Answer Them

Common Numbers-Based Questions I Get As A Flow Cytometry Core Manager And How To Answer Them

By: Tim Bushnell, PhD

Numbers are all around us.  My personal favorite is ≅1.618 aka ɸ aka ‘the golden ratio’.  It’s found throughout history, where it has influenced architects and artists. We see it in nature, in plants, and it is used in movies to frame shots. It can be approximated by the Fibonacci sequence (another math favorite of mine). However, I have not worked out how to apply this to flow cytometry.  That doesn’t mean numbers aren’t important in flow cytometry. They are central to everything we do, and in this blog, I’m going to flit around numbers-based questions that I have received…

How To Do Variant Calling From RNASeq NGS Data

How To Do Variant Calling From RNASeq NGS Data

By: Deepak Kumar, PhD

Developing variant calling and analysis pipelines for NGS sequenced data have become a norm in clinical labs. These pipelines include a strategic integration of several tools and techniques to identify molecular and structural variants. That eventually helps in the apt variant annotation and interpretation. This blog will delve into the concepts and intricacies of developing a “variant calling” pipeline using GATK. “Variant calling” can also be performed using tools other than GATK, such as FREEBAYES and SAMTOOLS.  In this blog, I will walk you through variant calling methods on Illumina germline RNASeq data. In the steps, wherever required, I will…

Understanding Clinical Trials And Drug Development As A Research Scientist

Understanding Clinical Trials And Drug Development As A Research Scientist

By: Deepak Kumar, PhD

Clinical trials are studies designed to test the novel methods of diagnosing and treating health conditions – by observing the outcomes of human subjects under experimental conditions.  These are interventional studies that are performed under stringent clinical laboratory settings. Contrariwise, non-interventional studies are performed outside the clinical trial settings that provide researchers an opportunity to monitor the effect of drugs in real-life situations. Non-interventional trials are also termed observational studies as they include post-marketing surveillance studies (PMS) and post-authorization safety studies (PASS). Clinical trials are preferred for testing newly developed drugs since interventional studies are conducted in a highly monitored…

How To Profile DNA And RNA Expression Using Next Generation Sequencing (Part-2)

How To Profile DNA And RNA Expression Using Next Generation Sequencing (Part-2)

By: Deepak Kumar, PhD

In the first blog of this series, we explored the power of sequencing the genome at various levels. We also dealt with how the characterization of the RNA expression levels helps us to understand the changes at the genome level. These changes impact the downstream expression of the target genes. In this blog, we will explore how NGS sequencing can help us comprehend DNA modification that affect the expression pattern of the given genes (epigenetic profiling) as well as characterizing the DNA-protein interactions that allow for the identification of genes that may be regulated by a given protein.  DNA Methylation Profiling…

How To Profile DNA And RNA Expression Using Next Generation Sequencing

How To Profile DNA And RNA Expression Using Next Generation Sequencing

By: Deepak Kumar, PhD

Why is Next Generation Sequencing so powerful to explore and answer both clinical and research questions. With the ability to sequence whole genomes, identifying novel changes between individuals, to exploring what RNA sequences are being expressed, or to examine DNA modifications and protein-DNA interactions occurring that can help researchers better understand the complex regulation of transcription. This, in turn, allows them to characterize changes during different disease states, which can suggest a way to treat said disease.  Over the next two blogs, I will highlight these different methods along with illustrating how these can help clinical diagnostics as well as…

What Is Next Generation Sequencing (NGS) And How Is It Used In Drug Development

What Is Next Generation Sequencing (NGS) And How Is It Used In Drug Development

By: Deepak Kumar, PhD

NGS methodologies have been used to produce high-throughput sequence data. These data with appropriate computational analyses facilitate variant identification and prove to be extremely valuable in pharmaceutical industries and clinical practice for developing drug molecules inhibiting disease progression. Thus, by providing a comprehensive profile of an individual’s variome — particularly that of clinical relevance consisting of pathogenic variants — NGS helps in determining new disease genes. The information thus obtained on genetic variations and the target disease genes can be used by the Pharma companies to develop drugs impeding these variants and their disease-causing effect. However simple this may allude…

7 Key Image Analysis Terms For New Microscopist

7 Key Image Analysis Terms For New Microscopist

By: Heather Brown-Harding, PhD

As scientists, we need to perform image analysis after we’ve acquired images in the microscope, otherwise, we have just a pretty picture and not data. The vocabulary for image processing and analysis can be a little intimidating to those new to the field. Therefore, in this blog, I’m going to break down 7 terms that are key when post-processing of images. 1. RGB Image Images acquired during microscopy can be grouped into two main categories. Either monochrome (that can be multichannel) or “RGB.” RGB stands for red, green, blue – the primary colors of light. The cameras in our phones…

We Tested 5 Major Flow Cytometry SPADE Programs for Speed - Here Are The Results

We Tested 5 Major Flow Cytometry SPADE Programs for Speed - Here Are The Results

By: Tim Bushnell, PhD

In the flow cytometry community, SPADE (Spanning-tree Progression Analysis of Density-normalized Events) is a favored algorithm for dealing with highly multidimensional or otherwise complex datasets. Like tSNE, SPADE extracts information across events in your data unsupervised and presents the result in a unique visual format. Given the growing popularity of this kind of algorithm for dealing with complex datasets, we decided to test the SPADE algorithm in 5 software packages, including Cytobank, FCS Express, FlowJo, R, and the original, free software made available by the author of SPADE. Which was the fastest?

5 FlowJo Hacks To Boost The Quality Of Your Flow Cytometry Analysis

5 FlowJo Hacks To Boost The Quality Of Your Flow Cytometry Analysis

By: Tim Bushnell, PhD

FlowJo is a powerful tool for performing and analyzing flow cytometry experiments, if you know how to use it to the fullest. This includes understanding embedding and using keywords, the FlowJo compensation wizard, spillover spreading matrix, FlowJo and R, and creating tables in FlowJo. Extending your use of FJ using these hacks will help organize your data, improve analysis and make your exported data easier to understand and explain to others. Take a few moments and explore all you can do with FJ beyond just gating populations.

Top Industry Career eBooks

Get the Advanced Microscopy eBook

Get the Advanced Microscopy eBook

Heather Brown-Harding, PhD

Learn the best practices and advanced techniques across the diverse fields of microscopy, including instrumentation, experimental setup, image analysis, figure preparation, and more.

Get The Free Modern Flow Cytometry eBook

Get The Free Modern Flow Cytometry eBook

Tim Bushnell, PhD

Learn the best practices of flow cytometry experimentation, data analysis, figure preparation, antibody panel design, instrumentation and more.

Get The Free 4-10 Compensation eBook

Get The Free 4-10 Compensation eBook

Tim Bushnell, PhD

Advanced 4-10 Color Compensation, Learn strategies for designing advanced antibody compensation panels and how to use your compensation matrix to analyze your experimental data.